Why I Disagree That Oil Will Re-Test $25
WHYTECLIFF FINANCIAL CORP.
By Bradley Parkes
Prerequisite Capital just released a good report on why oil will sell off to $25 per barrel. I disagree. Below I review their presentation and provide my counter argument.
Slide 4. Inventory Overhang
Normalized oil inventories are building slower than they do on average this time of year.

Confluence Investment Management

Bloomberg June 27, 2016
Saudi inventories are declining as exports and domestic demand outstrip production.

St. Louis Fed Fred July 11, 2016
The yellow circles represent periods of time where Saudi inventories declined.
It appears OPEC production is peaking. OPEC less Saudi and Iraq is down quite substantially and Saudi Arabia has peaked for now.

OMR Report Data April 2016
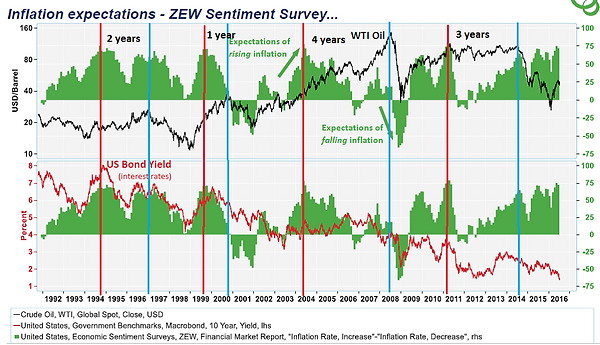
Slide 6 – Inflation Expectations and Oil Prices

Their presentation states that when Inflation Expectations peak oil peaks, yet the relationship has a weak correlation. The red lines are the peaks in inflation expectations and the blue lines are peaks in in oil. Note the time frame is as long as 4 years between peaks to as short as 1 year. Hardly a good metric.
Slide 7 – Crude Oil Volatility

On slide 7 Prerequisite Capital states they expect crude volatility to increase. As you can see in the chart above, oil bottoms when it increases which would be bullish and not bearish.
My Theory - Reflation Thesis
Generals always fight the last war and economists always fight the last depression.
Commodities bottom in a repetitive manner. Gold bottoms first and tops first, while crude and copper bottom simultaneously but copper tops first. Since 1986 (when oil futures first started trading), only once this relationship did not hold and that was gold topping later in 2011.

On the charts below the green lines mark major bottoms and the red lines mark major tops.

St. Louis Fed Fred Research July 11, 2016

St. Louis Fed Fred Research July 11, 2016

St. Louis Fed Fred Research July 11, 2016
Economic Expansion, Core Inflation, Unemployment and Wage Growth
Ned Davis Research has discovered that the economy is in expansion when the S&P500 is 3.6% above the 5 month smoothed trend. As of Friday July 8, 2016 the S&P500 is 6.1% above this the 5 month moving average.

US Global Funds June 2016
The above chart from US Global shows that the oil price tracks World GDP.
Commodities rise when US unemployment is below 6%.

WellsCap Management
Wage growth is now growing at the fastest rate since the 2008-2009 financial crisis. Deflation is behind us, not ahead.

Richmond Fed July 11, 2016

CIBC June 20, 2016
And why all commodities have rallied this year.

Visual Capitalist July 2016
The US Dollar Effect
Crude oil only became an anti-dollar trade when the Euro came into existence. Crude oil will rally with the dollar going forward.
The red box shows when the dollar and oil declined together, the green boxes are periods when oil and the dollar rallied together and yellow when they were inversely correlated, pre-Euro. With the potential end of the Euro, oil will likely become less of an anti-dollar trade and begin to trade on economic activity.

St. Louis Fed Fred Research July 11, 2016

Confluence Investment Management June 24, 2016
CIM calculates the fair value oil price based on the EUR/Dollar exchange rate which comes in at about $40.
Has Oil Bottomed?
Looking at the futures curves from the last major supply side decline, it shows a flattening and eventual backwardation of the front end indicating supply is being bid from storage. Below is the curve from 1986 at the bottom.

CME Group
The current WTIC future curve has been flattening.

CME Group
Alliance Bernstein has also noted this trend in past oil cycles.

Alliance Bernstein March 11, 2016

Note how the largest one day rallies tend to happen bottoms.
The FED
The recent dot plot chart left some scratching their heads until James Bullard explained his new regime theory and how the FED should become reactionary (with a lag) and not anticipatory. Bullard wants the FED to fall behind the curve. Paul Krugman once suggested the way Japan would end its deflation is if people lost their “awe” of central bankers. Bullards regime theory is designed to do that.

Confluence Investment Management June 24, 2016
Where is Oil Going?

Stockcharts.com
Oil should test $42 and if I am correct that will mark a higher high and the end of Wave 2 of the Elliot Wave Count.

CME Group
If I have the EWT count correct, Wave 3 targets the $65 region and should be complete at the end of 2016.
And finally, not to pick on the Economist, but this cover marked the bottom in 1998

And this was the January 2016 cover.

Disclosures:
Investors should carefully consider the investment objectives, risks, charges and expenses of any investment. The above does not constitute investment advice or recommendations, just crazy ideas I have when I cannot sleep. There is no guarantee that any investment (or this investment) will achieve its objectives, goals, generate positive returns, or avoid losses. The information provided should probably be disregarded and potentially treated as a contrarian advice, with the expectations that I am 100% wrong on everything. Please consult someone with a higher level of intelligence than the author with respect to investing money.